
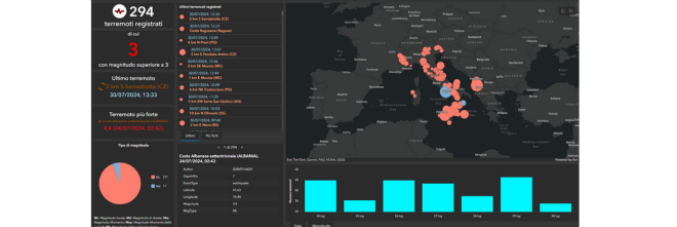
A monitoring dashboard to view the earthquakes occurred in Italy in the last 7 days
30.07.2024
Dashboards are GIS WebApps that display data through maps, providing an at-a-glance visualisation. They use indicators, graphs, lists, and detail boxes to convey information connected to the map, and all these elements interact. When a dashboard uses real-time data, it is usually referred to as a Monitoring Dashboard.
An example is the one presented in this video, created by our GIS technician Roberto Rossi using ArcGIS Dashboard. This dashboard allows users to interactively view the earthquakes that occurred in Italy in the last 7 days, based on the data published by the National Institute of Geophysics and Volcanology (INGV).
Users can view the most recently detected earthquake, the largest in magnitude, and the number of earthquakes above magnitude 3. Interacting with the lists enables users to highlight the last and largest earthquakes on the map. By interrogating the charts, the map will display only the selected category of earthquakes. Additionally, zooming in on the map updates all the charts and indicators based on the extent.
This dashboard works in English:
An Italian language version is also available:
For any further information write to roberto.rossi@unipd.it